console shows kernal error during startup
7/8/14 2:06:55 AM kernel Data/Stack execution not permitted: firefox[pid 177] at virtual address 0x116599000, protections were read-write
I get this sort of error ALL THE TIME but noticed it now when just starting Firefox.
7/8/14 2:06:52 AM [0x0-0x1a01a].org.mozilla.firefox[177] Background starting...
7/8/14 2:06:55 AM kernel Data/Stack execution not permitted: firefox[pid 177] at virtual address 0x116599000, protections were read-write
ALSO: How can I get rid of the error shown below? How do I turn off the debugger if the bugger is running? I clicked around in it at some point trying to learn about FF so maybe I turned something on...
7/8/14 2:06:48 AM kernel firefox (map: 0xe37ec2c) triggered DYLD shared region unnest for map: 0xe37ec2c, region 0x7fff81000000->0x7fff81200000. While not abnormal for debuggers, this increases system memory footprint until the target exits.
All Replies (1)
Does this also happen if you start Firefox in Safe Mode?
Try Firefox Safe Mode to see if the problem goes away. Firefox Safe Mode is a troubleshooting mode that turns off some settings, disables most add-ons (extensions and themes).
If Firefox is open, you can restart in Firefox Safe Mode from the Help menu:
- In Firefox 29.0 and above, click the menu button
 , click Help
  and select Restart with Add-ons Disabled.
- In previous Firefox versions, click on the Firefox button at the top left of the Firefox window and click on Help (or click on Help in the Menu bar, if you don't have a Firefox button) then click on Restart with Add-ons Disabled.
If Firefox is not running, you can start Firefox in Safe Mode as follows:
- On Windows: Hold the Shift key when you open the Firefox desktop or Start menu shortcut.
- On Mac: Hold the option key while starting Firefox.
- On Linux: Quit Firefox, go to your Terminal and run firefox -safe-mode
(you may need to specify the Firefox installation path e.g. /usr/lib/firefox)
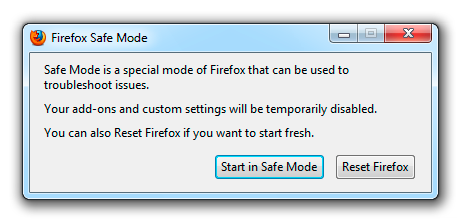
When the Firefox Safe Mode window appears, select "Start in Safe Mode".

If the issue is not present in Firefox Safe Mode, your problem is probably caused by an extension, and you need to figure out which one. Please follow the Troubleshoot extensions, themes and hardware acceleration issues to solve common Firefox problems article to find the cause.
To exit Firefox Safe Mode, just close Firefox and wait a few seconds before opening Firefox for normal use again.
When you figure out what's causing your issues, please let us know. It might help others with the same problem.
