Unexplained Exception Errors in Console
Often I am on a page and it will hang for a bit, so I resorted to having the Browser Console open when visiting some of the pages where I have noticed it happening to see what if any errors are presented in the console that might shed light on that.
Well, I can't say I didn't get what I asked for, hundreds of thrown exceptions but frankly I can't make sense of them and when trying to research them, all Mozilla says is that its a generic error where we shove anything we don't know how to explain, so that's immensely helpful - not.
So I am hoping someone here has seen this or at least knows how to figure out what it is and what's causing it beyond, its a generic error for things we don't know and so therefore there is not actual helpful resource :)
In particular, it says it is from ThreadSafeDevToolsUtils.js:88 but looking at it provides literally no helpful insight.
Here is the error (hundreds of them, but I'll give you just one copy):
"Handler function threw an exception: [Exception... "Component returned failure code: 0x80004005 (NS_ERROR_FAILURE) [nsITraceableChannel.setNewListener]" nsresult: "0x80004005 (NS_ERROR_FAILURE)" location: "JS frame :: resource://gre/modules/commonjs/toolkit/loader.js -> resource://devtools/shared/webconsole/network-monitor.js :: _setupResponseListener :: line 1262" data: no] Stack: _setupResponseListener@resource://gre/modules/commonjs/toolkit/loader.js -> resource://devtools/shared/webconsole/network-monitor.js:1262:28 _createNetworkEvent@resource://gre/modules/commonjs/toolkit/loader.js -> resource://devtools/shared/webconsole/network-monitor.js:1138:5 _onRequestHeader@resource://gre/modules/commonjs/toolkit/loader.js -> resource://devtools/shared/webconsole/network-monitor.js:1163:5 NetworkMonitor.prototype.observeActivity<@resource://gre/modules/commonjs/toolkit/loader.js -> resource://devtools/shared/webconsole/network-monitor.js:1015:7 exports.makeInfallible/<@resource://gre/modules/commonjs/toolkit/loader.js -> resource://devtools/shared/ThreadSafeDevToolsUtils.js:109:14 Line: 1262, column: 0"
/**
* Report that |who| threw an exception, |exception|.
*/
exports.reportException = function reportException(who, exception) {
 const msg = `${who} threw an exception: ${exports.safeErrorString(exception)}`;
 dump(msg + "\n");

 if (typeof console !== "undefined" && console && console.error) {
-->   console.error(msg);
 }
};
Does anyone have a clue what is going on here and can help clarify things for me please?
Alle Antworten (1)
Hi, what web site page did you get the error on please ?
Could you also Try Firefox Safe Mode to see if the problem goes away. Firefox Safe Mode is a troubleshooting mode that temporarily turns off hardware acceleration, resets some settings, and disables add-ons (extensions and themes).
If Firefox is open, you can restart in Firefox Safe Mode from the Help menu:
- Click the menu button
 , click Help
  and select Restart with Add-ons Disabled.
If Firefox is not running, you can start Firefox in Safe Mode as follows:
- On Windows: Hold the Shift key when you open the Firefox desktop or Start menu shortcut.
- On Mac: Hold the option key while starting Firefox.
- On Linux: Quit Firefox, go to your Terminal and run firefox -safe-mode
(you may need to specify the Firefox installation path e.g. /usr/lib/firefox)
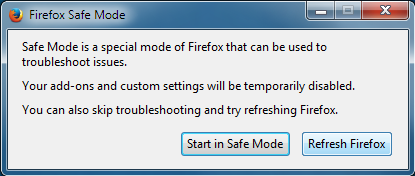
When the Firefox Safe Mode window appears, select "Start in Safe Mode".
If the issue is not present in Firefox Safe Mode, your problem is probably caused by an extension, theme, or hardware acceleration. Please follow the steps in the Troubleshoot extensions, themes and hardware acceleration issues to solve common Firefox problems article to find the cause.
To exit Firefox Safe Mode, just close Firefox and wait a few seconds before opening Firefox for normal use again.
When you figure out what's causing your issues, please let us know. It might help others with the same problem.

