How Do I Add "Browser Toolbox" To My Tools Menu?
On a Mac; 10.11.
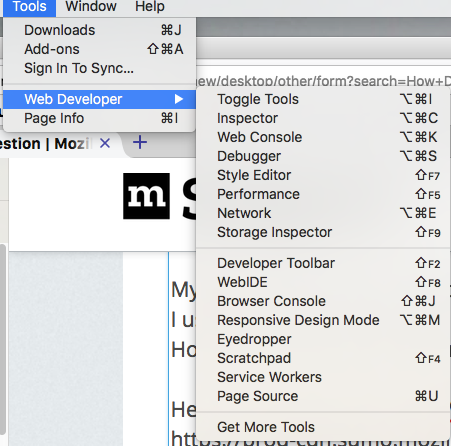
My iMac at home has the Browser Toolbox as an option under tools; my iMac at work, and my MacBook Pro do not have it. I use it to update my user.Chrome.css when necessary. How do I locate it and get it into my Tools?
Here's a screenshot of the iMac that has it: https://prod-cdn.sumo.mozilla.net/uploads/images/2018-03-05-08-57-25-21b52c.png
Here's a screenshot of what I have at work (which is obviously missing some tools):
https://prod-cdn.sumo.mozilla.net/uploads/images/2018-03-05-08-58-56-68d39d.png
Chosen solution
See:
The Browser Toolbox is not enabled by default.
To enable it you need to check the settings "Enable chrome and addon debugging" and "Enable remote debugging".

To do this, open the Developer Tools Settings, go to the section "Advanced Settings", and check the settings "Enable browser chrome and add-on debugging toolboxes" and "Enable remote debugging".
devtools.chrome.enabled = true devtools.debugger.remote-enabled = true
Read this answer in context 👍 1All Replies (1)
Chosen Solution
See:
The Browser Toolbox is not enabled by default.
To enable it you need to check the settings "Enable chrome and addon debugging" and "Enable remote debugging".

To do this, open the Developer Tools Settings, go to the section "Advanced Settings", and check the settings "Enable browser chrome and add-on debugging toolboxes" and "Enable remote debugging".
devtools.chrome.enabled = true devtools.debugger.remote-enabled = true


