in developer toolbar in network tab timeline shows upto 8 minutes of transaction
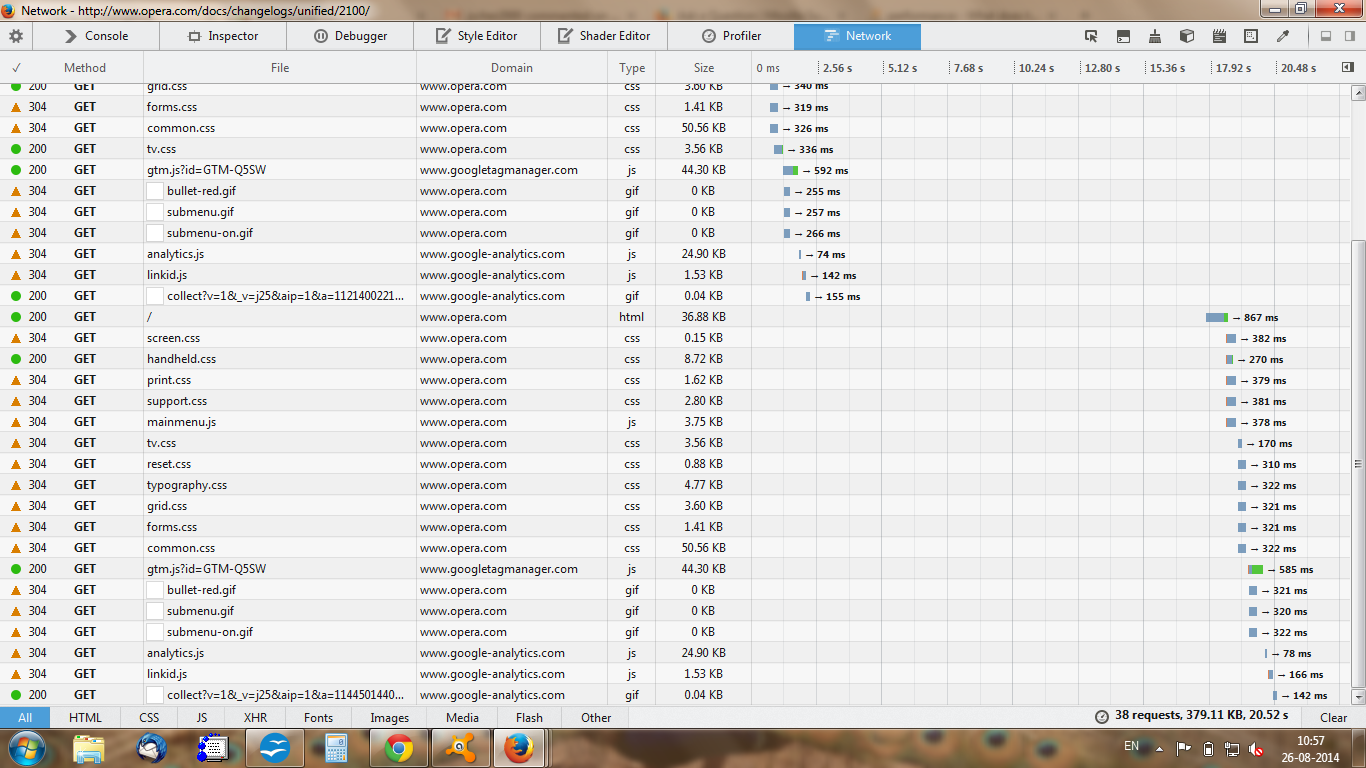
In developer toolbar in network tab after starting performance analysis and reloading page, for first 8.19 minutes , time taken to access resources such as html page, css file, images etc and all post requests along with details of Method, File, Domain, Size, Type. However, after 8.19 minutes of activity, other details except time taken are displayed. One has to click on each record and there you see a split of DNS Lookup, Sending, Connecting and Receiving time. Horizontal scrollbar should be instead displayed and user should be able view time taken for records. Also the other details such as Method, File, Domain, Size, Type should remain static like freezed panes in spreadsheets and only timeline part scrollable.
모든 댓글 (1)
Example file of developer toolbar showing timings.